In production · v1.1

Know what broke, before your customers do

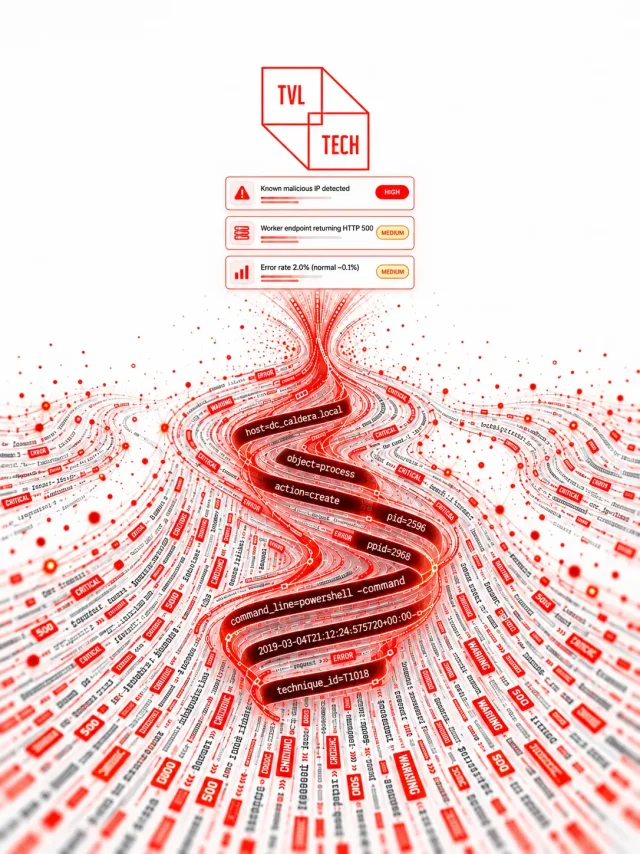
Your systems write about 400,000 log lines a day explaining exactly what is going wrong. Nobody reads them.
Harold does, and hands your team the ten that matter — with the root cause and the evidence already attached.

Harold dashboard over a 24-hour window on one live deployment: 391,703 lines collected, 149 recent alerts, 10 high or critical, 8 of 15 active sources, a severity distribution chart and the live alert stream with root causes.
394,630
Lines read for you in 24 hours, across 15 sources
10
Items handed to a person, one per ~39,000 lines
916
Hostile events caught in six days on "quiet" systems
2.8s
Average time to analyse an event; known attacks in zero
From the team behind European Commission · EBSI DataDiggers NATO DIANA
The problem

Every day your platform explains itself 394,630 times. Nobody is listening.

The line that explains the outage is already in the log file. At a few hundred thousand lines a day, dashboards show rates and averages, and the single stack trace, the scanner probing an admin path and the new error template that appears two hours before the failure never move an average.

Attention does not scale. Reading 400,000 lines a day is not a discipline problem, it is arithmetic. Sampling misses the events that matter, because they are rare by definition.

Thresholds fire after the symptom. Classic monitoring alerts when a metric crosses a line. The failing dependency and the credential-stuffing attempt are visible in the text well before that.

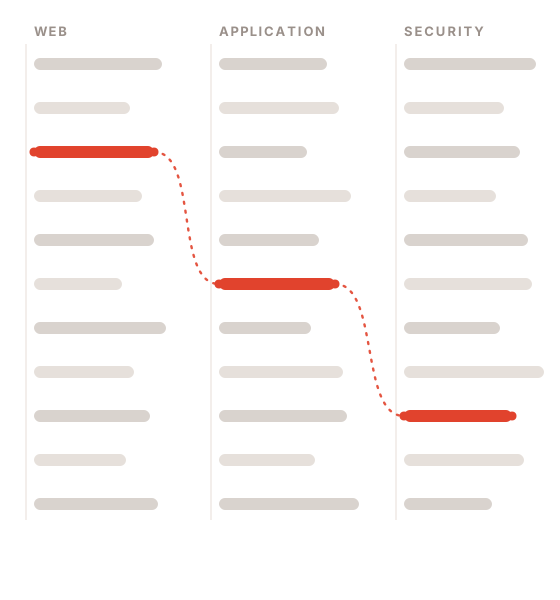
Understanding takes five tools. When an alert does fire, an engineer reconstructs the story across log viewer, metrics, provider console and chat history. Time to understanding is the real cost.

Sending everything to a model is not affordable. Analysing every batch with a language model costs more than the infrastructure it watches, and most of those calls confirm that nothing happened.

How it works

Three services joined by a queue, from raw log line to a closed incident

Collection, analysis and presentation are separate processes. The broker between them is what makes a model change or a worker restart a non-event.

Collector
Every source in one place
Polls each source, groups lines into batches, deduplicates and publishes to the queue
Worker
The decision funnel
Runs eight local gates, calls the model only when needed, scores risk and correlates incidents
Dashboard
One screen for the estate
Alerts, incidents, sources, blocklists and enforcement, with users, roles and a full audit trail
01

Collect

DigitalOcean, Google Cloud Run and Cloud SQL, AWS Fargate and Heroku are read through their own APIs. A small shell agent covers any file, container or journald unit. RabbitMQ absorbs traffic spikes and survives worker restarts.

✓ Nothing changes on your production machines
02

Decide & explain

Each batch runs the gate funnel. For genuinely new behaviour the model returns a structured verdict — severity, category, root cause, affected routes, the evidence lines and a recommended action — never free text.

✓ An alert is a complete explanation, not red text
03

Correlate & respond

Related alerts share a fingerprint and collapse into one incident with a timeline, an owner and a status. Hostile addresses and routes can be blocked at the Cloudflare edge and inside the application, from the same screen.

✓ Sixteen alarms about one failure become one piece of work
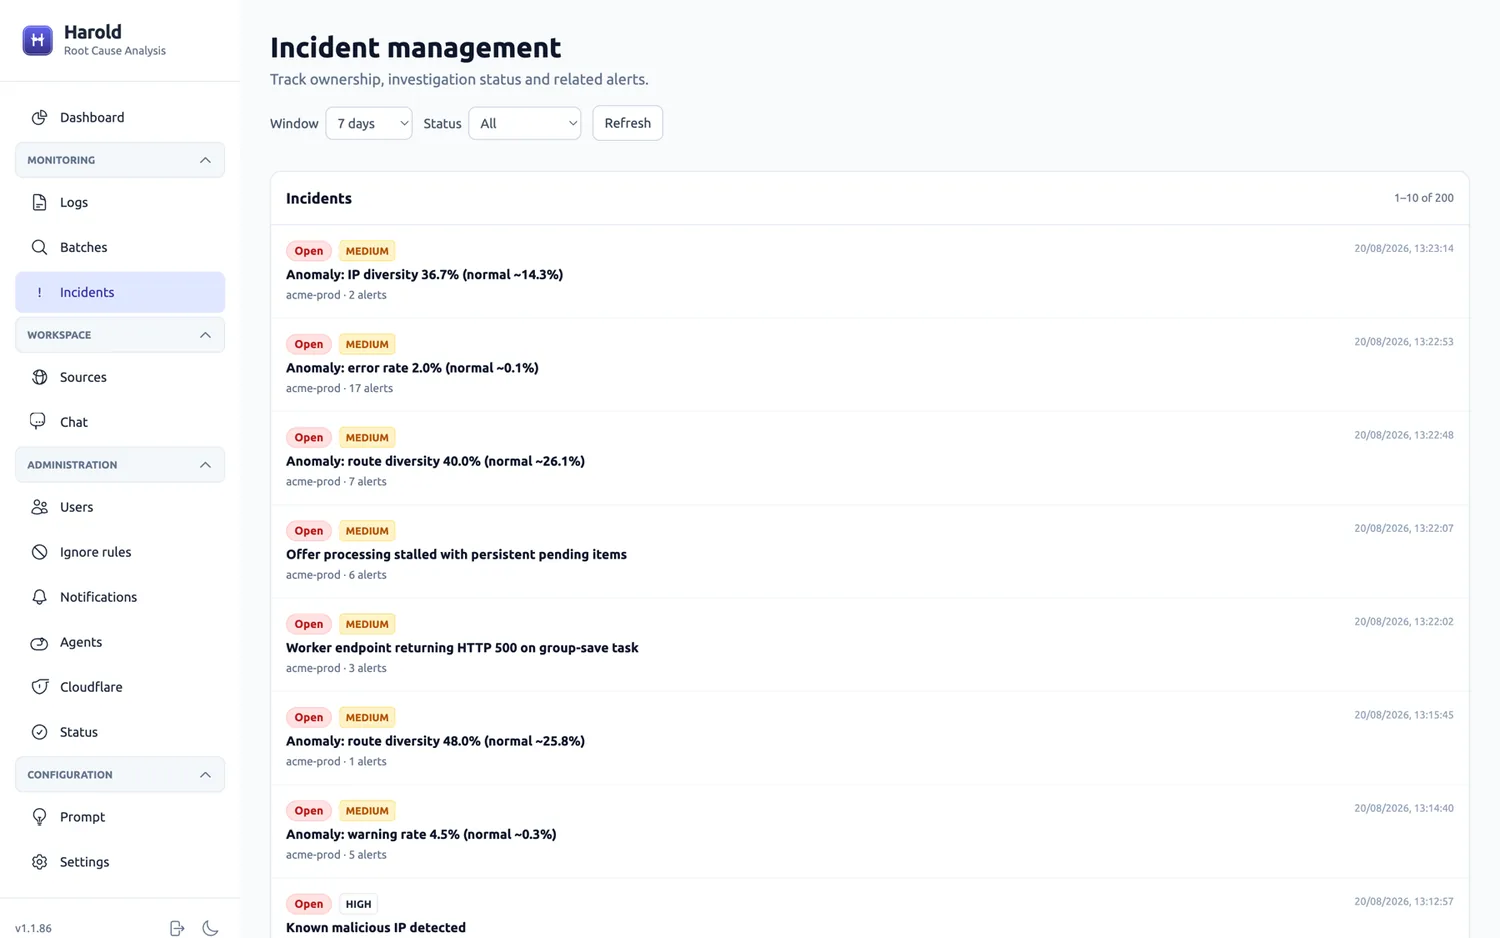
Harold incident management: a list of open incidents, each with a status, a severity and the number of alerts it collapsed — the noise removed. Recurring failures reopen their own record and keep their history.
IncidentsFindings that describe the same failure are grouped into one item. The alert count on each row is the noise that was removed.
The cost funnel

Eight gates run before the model. The first one that can decide, decides.

Gates 1 to 8 are local: no external service, no tokens, single-digit milliseconds. Gate 9 is the only one that spends money — and on a live deployment about one analysis in three never reached it.

1
Ignore rules

Operator-defined patterns and paths dropped before anything runs. Known benign noise costs nothing.

2
Attack signature rules

Scanner paths, SQL injection and traversal payloads produce an instant verdict with no model call.

3
Sequence detection

Authentication failures counted per account over a sliding window, so brute force behind a CDN is still caught.

4
Threat intelligence

Client addresses matched against an imported reputation feed. A known malicious address resolves the batch at high severity.

5
Signature cache

Configured log signatures reuse a previous verdict for a known recurring issue, invalidated when the prompt changes.

6
Novelty detector

Log templates are mined continuously. A batch built only from templates already seen contains nothing structurally new.

7
Statistical anomaly gate

A local model learns each application's error rate, status mix, route and address diversity, then flags deviation.

8
Verdict cache

Identical log structures reuse a recent verdict; near-identical ones match by similarity after normalisation.

9
Only gate that spends moneyLanguage model analysis

Reached only when the batch is structurally new or statistically unusual. Sensitive values are redacted first; the model returns a structured verdict, never free text.

10
Risk score, correlation, notification

An explainable score combines detector signals with deviation from the application's own baseline. The alert joins an incident and reaches the right channel.

A single batch replayed gate by gate: ignore rules skipped, instant rules and caches checked, novelty detector found new log structures, so gate 9 (AI analysis) ran — qwen3.7-flash, 7,840 tokens, 5.9s — and reported a low-severity 404. Each stage shows its own outcome.
Batches · DecisionOpen any batch and the funnel is replayed, gate by gate. The stage that produced the verdict is marked, with the model, tokens and duration recorded per batch.
Why this order matters
Cost tracks novelty, not volume

Each gate is cheaper than the one after it. A scanner hitting /.env is answered at gate 2 in zero seconds and never reaches a model that would have charged for the same conclusion. Doubling traffic that repeats itself does not double the bill.

One analysis in three answered without AI

In a census of 60,000 consecutive analyses, 33% were resolved by the local gates — familiar behaviour, a reused verdict, a known attack pattern or a known hostile address. That single ratio determines the running cost, and the Batches screen reports it per application.

Detection stack

Six detectors, each good at something the others miss

None of them depends on a language model, which is why they can run on every batch without a cost ceiling.

Deterministic

Attack signatures

Requests for credential files, version-control directories, admin panels and database dumps, plus injection and traversal payloads. Instant and reproducible.

Deterministic

Sequence detection

Authentication failures aggregated per account over a sliding window. Counting accounts rather than addresses keeps it effective behind a CDN.

Deterministic

Threat intelligence

A reputation feed of known malicious addresses, matched on every batch. Hits are raised at high severity with the offending lines attached.

Learned

Template mining

The set of templates an application emits is learned continuously. A line whose shape has never been seen is the earliest available signal of a new failure mode.

Learned

Statistical anomaly detection

A per-application baseline over error rate, warning rate, status mix, route and address diversity and latency. Deviations name the feature that moved and by how much.

Composite

Explainable risk score

Detector signals and baseline deviation combine into a score with a confidence value and a list of contributing signals. It recommends observing or acting, and never blocks on its own.

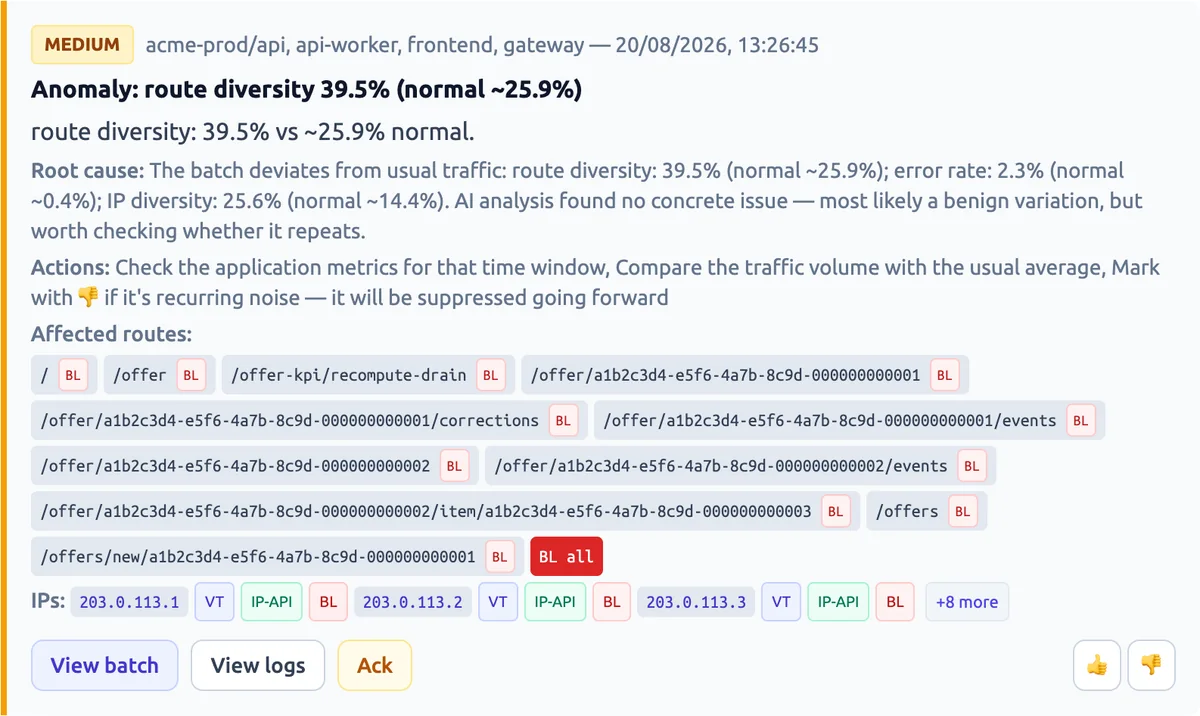
A single Harold alert: severity, source and component, a plain-language root cause stated against the application's own baseline, recommended actions, the affected routes, the client addresses and the controls — view batch, view logs, acknowledge, block — an engineer needs next.
AlertAn alert is a complete explanation, not a line of red text: root cause in plain language, the evidence one click away, and the next action in reach.
What it catches

916 hostile events in six days, on systems that were considered quiet

Continuous scanning is the normal background of anything exposed to the internet. The difference is whether you can see it and act on it.

1 in 65
analyses were hostile

The rate of hostile events, continuously

Across every exposed application: 779 scanning attempts probing for files and panels that should never be requested, and 137 requests from addresses on a maintained threat list — recognised instantly, at no analysis cost.

Blocked before it costs you

Hostile traffic is dropped before it reaches your servers, so a scanning campaign does not turn into an infrastructure bill or an incident.

Blocking, not just reporting

An address or a route can be blocked from the same screen that found it. The block is pushed to your edge provider and enforced inside the application.

A record for the auditor

What was detected, when, what was decided and by whom — available months later, in one place, without reconstructing it from four systems.

EnforcementOne blocklist, synchronised into Cloudflare per zone and enforced in-application, so hostile traffic is dropped before it reaches your origin or costs compute.
In the shipped product

One platform, from raw log line to a closed incident

Every capability below is in the shipped product and visible in the running deployment.

Every source in one place: managed cloud APIs and a shell agent for any file, container or journald unit
Eight local gates before the model: ignore rules, signatures, threat intel, template mining, statistics and caches
Structured root cause: severity, category, root cause, affected routes, evidence lines and a recommended action
Alerts become incidents: related alerts share a fingerprint and collapse into one item with a timeline and an owner
Per-application routing: channels bound to an application and a minimum severity, so a team hears about its own system only
Block at the edge and in-app: addresses and routes synchronised into Cloudflare and enforced by an in-process guard
Quieter over time: negative feedback marks a pattern as a false positive; ignore rules and learning reduce noise
Auditable months later: decision path, prompt, raw response and source lines retained per batch and replayable
Runs on your infrastructure: one compose stack — PostgreSQL, RabbitMQ, Redis — scaling from one worker to many
Fully local model supported: run the whole pipeline on Ollama or LM Studio when log content must not leave the perimeter
Works with

Reads the platforms you already run

Cloud sources are discovered through their own APIs. Everything else uses a small, scoped agent.

DigitalOcean Google Cloud Run Google Cloud SQL AWS Fargate Heroku Docker journald Log files Cloudflare Ollama LM Studio
SourcesCloud sources are discovered through their own APIs; per-source enable, disable and manual pull, with collection errors surfaced in the interface.
Reliability & scale

391,703 lines in a day, reduced to ten items worth opening

33%
answered without the AI

Cost tracks novelty, measured on a live deployment

A census of 60,000 consecutive analyses over six days: one in three resolved by the local gates. The reference deployment handles roughly 400,000 lines a day on shared infrastructure with two worker consumers.

Recoverable by design

Every batch carries a status of pending, processing, completed or failed. Batches stuck in processing are republished automatically, and any batch can be replayed from the interface.

Scales horizontally

Add workers when volume grows. Collection and the interface are untouched, and the queue distributes work automatically. Redis coordinates rate limiting across workers.

Harold system status screen: database, broker, worker and collector components each reporting operational, with the RabbitMQ message count, worker consumers and the timestamp of the last collected log.
System statusDatabase, broker, worker and collector, each reporting their own health — source-level collection errors surface here instead of in a log file nobody reads.
Control & risk

A monitoring platform holds the most sensitive text in the estate

Harold is built on the assumption that it is itself a target, and that log content must be treated as personal data by default.

Redaction before analysis

API keys, tokens, authorization headers, JWTs, passwords, e-mail and network addresses and identifiers are replaced with stable placeholders before any text leaves for a model.

Data can stay inside

With a locally hosted model the whole pipeline runs inside your perimeter and no log content reaches a third party. The interface, or only the ingest endpoints, can be limited to specific addresses or a VPN.

Least privilege and audit

Invite-only, passwordless sign-in with three roles separating reading from operating from administering. Provider tokens live in an encrypted vault, and sensitive actions are written to an audit log.

GDPR-aware Redaction by default Encrypted secret vault Passwordless sign-in Role-based access Full audit trail On-premise capable Fail-open enforcement
How it compares

The same job, done three ways

Threshold monitoring

Alerts when a metric crosses a line, after the symptom shows. It cannot read the stack trace, the scanner or the new error template in the text, and it says nothing about root cause. The engineer still reconstructs the story by hand.

Send every batch to an LLM

Explains well, then bills more than the infrastructure it watches. Most calls confirm nothing happened, latency rides on a third party, and by default your raw log content leaves your perimeter.

TVL Harold

Reach for the model last

Eight local gates answer most batches for free; the model is called only for genuinely new behaviour. Every alert carries root cause and evidence, blocking is one click, and the whole thing can run inside your perimeter with auditable decisions.

How TVL Harold compares with threshold monitoring and sending every batch to a language model, capability by capability.
Capability Threshold monitoring LLM on every batch TVL Harold
Reads every line, not a sampleNoYesYes
Root cause and evidence in the alertNoYesYes
Flat cost as traffic repeatsYesNoYes
Catches scanning & known-hostile trafficPartialPartialYes
Alerts collapse into owned incidentsPartialNoYes
Block at edge and in-applicationNoNoYes
Runs fully on-premise / local modelPartialRarelyYes
Every decision replayable for auditNoPartialYes
Track record

Built by a team the European Commission trusts

100+
Projects delivered
6
Industries
3
Countries · LU, RO, US
30
Person team across AI, blockchain and data

EBSI, for the European Commission

Our CTO designed and audited the smart contracts behind the EU's European Blockchain Services Infrastructure.

Enterprise scale

Our CEO scaled eMAG Marketplace to $1B ARR, and sits in the European Commission's AI Group of Practice.

Trusted & recognised

Trusted by DataDiggers. NATO DIANA mentor and judge. A senior, international team in Luxembourg, Romania and the US.

How to find out cheaply

Two weeks, one production application, three numbers

The pilot is designed so the decision at the end is made on your traffic, not on this page.

01

Week 1 · Connect and calibrate

We connect the sources for one production application, watch what it raises, and switch off the patterns your team recognises as normal. Nothing changes in your systems.

02

Week 2 · Run it for real

Findings go to the team that owns the application, in the channel they already use. They work them as they would any other item.

03

Day 15 · Decide on evidence

We review three numbers together — was it worth opening, did we learn something new, what does it cost to run — and you decide whether to extend, adjust or stop.

FAQ

The questions your risk officer will ask

It does not have to. The whole platform, including the analysis, can run entirely inside your own environment on a locally hosted model such as Ollama or LM Studio. Nothing is sent to a third party by default, and addresses, credentials and identifiers are redacted before any text reaches a model.
Eight local, deterministic or statistical gates run before any model call, and each one can end the analysis on its own. On a live deployment about one analysis in three was answered without the AI, so the bill tracks genuinely new behaviour rather than traffic volume. A scanner hitting a known bad path is answered in zero seconds at gate two.
No. Harold connects to the cloud accounts and applications you already run through their own APIs. Anything outside a managed cloud service sends its logs through a small shell agent authenticated by a scoped, revocable key. It runs as one compose stack on your infrastructure.
Every finding carries its confidence and the evidence lines behind it, and a person can overrule it. Harold recommends; it does not act on your production traffic by itself. Marking an item as noise suppresses that pattern going forward, so the queue gets shorter as the team uses it.
Monitoring being unavailable never blocks your applications. The in-application guard fails open, letting traffic through rather than stopping it, so a monitoring outage never becomes an application outage.
Both. An address or route can be blocked from the same screen that found it; the block is pushed to your edge provider (Cloudflare) and enforced inside the application. Blocking stays an explicit human decision — Harold scores the risk and recommends, but does not auto-block on a statistical score.
A two week pilot on one production application. We connect the sources, tune the ignore rules in the first days, then review three numbers with you: the share of alerts worth opening, whether it surfaced something new, and what it costs to run. It needs read access to one application's logs, one chat channel and about two hours of an engineer's time.

Point Harold at one application

A two week pilot on your own traffic. We connect it, tune it in the first days, and review three numbers with you at the end. If they don't convince you, we stop there.

Book a 30-minute scoping call. Tell us one production application and we'll take it from there.

Prefer email? Write to